Pages

Sunday, November 29, 2015

Using PlatformIO for Embedded Projects

I recently started using the PlatformIO system. It is a command line based development environment for many of the embedded platforms out there, such as the Arduino, Teensy, and Amtel, and I thought it would give me an easy way of automating my software builds, so decided to try it for one of my current projects. You can learn more at http://www.platformio.org. As a quick overview, it is a Python-based system that connects to a variety of toolchains, such as avrdude and gcc-avr that also has a very nice system for downloading board descriptions and libraries and all of their dependencies and making them available for your projects.

To give you an idea of how much time and effort PlatformIO saves you, the following is the set of commands to compile a project of mine for a room sensor that I will be talking more about in a future post.

$ avr-gcc -Os -g -std=gnu99 -Wall -funsigned-char -funsigned-bitfields \
    -fpack-struct -fshort-enums -ffunction-sections -fdata-sections \
    -DF_CPU=20000000UL -DBAUD=9600UL -I. -mmcu=atmega328p \
    -c -o roomsensor.o roomsensor.c

$ avr-gcc -Wl,-Map,blinkLED.map  -Wl,--gc-sections  -mmcu=atmega328p \
    roomsensor.o -o roomsensor.elf

$ avrdude -c usbtiny -p m328p -e -U flash:w:roomsensor.elf

That is a lot! Many people will wrap all this up into a Makefile so they don't have to do type in each command every time, but if something changes about your program and its needs or you decide to target it another board, you may find yourself having to modify various parts of build process. Also, personally I hate creating Makefiles, so if I can find a process that eliminates the need to write them, I am happy.

With PlatformIO, the commands to compile and upload the software is

$ platformio run -t upload

Let's get PlatformIO installed. I am using a Linux-based system, so my installation instructions are for that. The documentation at PlatformIO is quite good, so you should find it easy to find instructions for your particular platform.

I tried just installing PlatformIO on my Linux laptop but found it wouldn't properly install due to the fact that my Linux distro didn't have the latest version of pip, so the instructions below makes sure you have the latest before installing PlatformIO

$ sudo pip install -U pip setuptools
$ sudo pip install -U platformio

Once PlatformIO is installed, you should create a directory for your new project and initialize it for a PlatformIO project with the following command.

$ platformio init

You can also specify things in the init command, like what board you are developing against. However, I am working with a bare ATMega328p chip and a USBTiny programmer and I could find nothing in the supported boards that would work with what I am using. It may be there, but I didn't find it.

The initialization process will create a src/ and lib/ directory for your project, as well as a platformio.ini file that will contain all information about your project and how it is to be build and uploaded. Since a bare init command was used without specifying a board or anything, I had to fill in the values myself using my favorite editor.

[env:mybaseenv]
platform = atmelavr
board_mcu = atmega328p
board_f_cpu = 20000000UL
upload_protocol = usbtiny -e

If you specify the board to be used, say an Arduino UNO, you will find very different contents in platformio.ini. The following command will initialize the project.

$ platformio init --board uno

The contents of platformio.ini will be filled in for you.

[env:uno]
platform = atmelavr
framework = arduino
board = uno

But on with the current project.

I then created the file roomsensor.c in the src/ directory. This program is for reading a PIR sensor and lighting an LED when the sensor detects motion. The PIR is wired to pin PB1 and the LED is wired to pin PB0.

#include <avr/io.h>
#include <util/delay.h>

int main(void) {

  // Set the direction of the LED port to output.
  DDRB |= 0b00000001;

  while (1) {
    if (PINB & 0b00000010) {
      // Light the LED.
      PORTB = 0b00000001;
    } else {
      // Turn the LED off.
      PORTB = 0b00000000;
    }

    _delay_ms(50);
  }

  return (0);
}

I will show the circuit for the room sensor in the post that will cover the sensor, for now I am just wanting to discuss PlatformIO. If you actually want to just blink an LED, you could eliminate the if statement and just use a couple of delays for the amounts of time you want the LED to remain on and remain off.

As stated above, you can now compile the program and upload it to the 328p with the following command.

$ platformio run -t upload

All in all, I have found PlatformIO to be easy to use. It was easiest to use when I used an Arduino. I had to do a bunch of experimentation to figure out how to handle the bare atmega328p and the USBTiny programmer, but now that I have that figured out, future projects will be as easy as a board supported by PlatformIO. Actually, I should look how to define my own board description that I can then make available for others to use.

Friday, November 27, 2015

Sensor Data To The Cloud: Part 2

OK, data in the cloud (at least if you saw the first post in this series), but for the moment the cloud is being used as WOM (Write Only Memory). What we want now is the ability to get the data out so that we can do something with it.

I plan eventually to be able to access the raw data points, probably using some sort of JSON format served by a web server interface, but for now let's have some fun and look at graphs in a web browser.

You can see the code on github at https://github.com/kmhughes/robotbrains-examples/tree/master/data/cloud/org.robotbrains.data.cloud.timeseries.server.

The current interface is very quick and dirty, but it at least let me start looking at the data. Here is an example of a couple of graphs from my test installation.


I first set up a small web server. I used the one from the Interactive Spaces open source project, though I made some changes to it that I have wanted to make for a while and moved it to using Netty 4 rather than Netty 3, cleaned out some of the deprecated methods, and did some general refactoring. These web server modifications will continue for some time as I get more familiar with the Netty 4 API, and decide on the new internal architecture for the web server. It was written in a rather demand driven fashion and now with 3 years of usage experience, it is definitely time for a cleanup.

The main class for the data web server is StandardDataWebServer. This class creates an instance of the Interactive Spaces web server and attaches a dynamic content GET handler. You can see this in the startup() method.

webServer = new NettyWebServer(webServerPort, log);
webServer.startup();

webServer.addDynamicContentHandler("graph", true, new HttpDynamicRequestHandler() {
  @Override
  public void handle(HttpRequest request, HttpResponse response) {
    handleGraphRequest(request, response);
  }
});

Notice that the URL prefix has been set to graph. Graph URL paths, minus the host and port for the webserver, will be of the form

/graph/source/sensing_unit/sensor?start=start_date&end=end_date

Here is the URL path I used for the temperature graph above.

/graph/keith.test/pi2/temperature?start=2015/11/23@00:00:00&end=2015/11/25@08:00:00

Here you can see that source is keith.test, the sensing_unit is pi2, and the sensor on the sensing unit is temperature.  The values for these fields are set in the Python script running on the Pi and your values will be different.

The date formats are easy enough. Year first, then month, then day. After the @ is the time in a 24 hour clock, so 00:00:00 is midnight.

The method handleGraphRequest() performs the following operations through various methods it calls:

  1. It parses the URL and creates the sensor data query with the method getDataQueryFromRequest().
    • The URL path components specify the exact sensor the data is wanted for.
    • The URL query parameters specify the start and stop dates for the query range.
  2. The sensor data query is handed to the Database Relay (class KairosDbDatabaseRelay) that then queries KairosDB to get the requested data. The query method called is 
    querySensorData().
  3. The results of the sensor data query are transformed into the correct components for a JFreeChart data graph and the chart is generated in renderChart().
    1. An XYDataset is created from the sensor data.
    2. A chart is then created from the XYDataset.
  4. Finally the JFreeChart chart is rendered as a PNG graphic and sent back to the web browser in writeChartResponse().
The JFreeChart dataset is easily created from the sensor data samples.

private XYDataset createDataset(SensorData data) {
  XYSeries series = new XYSeries("Fun Data");
  for (SensorDataSample sample : data.getSamples()) {
    try {
      series.add(sample.getTimestamp(), sample.getValue());
    } catch (SeriesException e) {
      log.error("Error adding to series graph", e);
    }
  }

  return new XYSeriesCollection(series);
}

The chart is then created.

private JFreeChart createChart(SensorDataQuery query, XYDataset dataset) {
  return ChartFactory.createTimeSeriesChart
      String.format("Sample Data: %s - %s - %s",
          query.getSource(), query.getSensingUnit(), query.getSensor()),
      "Time", "Value", dataset,
      false, false, false);
}

The chart is then finally written to the web browser.

private void writeChartResponse(HttpResponse response, JFreeChart chart) throws IOException {
  BufferedImage chartImage = chart.createBufferedImage(560, 370, null);
  ImageIO.write(chartImage, "png", response.getOutputStream());
  response.setContentType(CommonMimeTypes.MIME_TYPE_IMAGE_PNG);
}

As you can see, the dimensions of the PNG graphic are currently fixed, eventually the height and width will be set from query parameters.

It was very easy to get JFreeChart to visualize my data for me, I look forward to learning more about the API.

The modifications to the class KairosDbDatabaseRelay were pretty simple as the KairosDB Java API is really easy to use. The query code is given below.

String metricName = createEventKey(query.getSource(), 
    query.getSensingUnit(), sensor);

QueryBuilder builder = QueryBuilder.getInstance();
builder.setStart(query.getStartDate().toDate())
    .setEnd(query.getEndDate().toDate());

builder.addMetric(metricName);

QueryResponse response = kairosdbClient.query(builder);
for (Queries queries : response.getQueries()) {
  for (Results results : queries.getResults()) {
    for (DataPoint dataPoint : results.getDataPoints()) {
      SensorDataSample sample =
          new SensorDataSample(sensor, dataPoint.doubleValue(),
              dataPoint.getTimestamp());

      data.addSample(sample);
    }
  }
}

KairosDB requires a metric name for each item it is storing time series data for. The Data Relay uses the source, sensing unit and sensor concatenated together with a spacer character to create its metric names. Eventually the Relay will contain a small database giving the sources, sensing units, and sensors to provide mappings for data types for the data. The metric name generated here will be in metricName.

Next a KairosDB QueryBuilder is created. The start and end dates for the query are then set. The Relay uses the Joda time library (if you are working with time in Java, you must use Joda), but the KairosDB wants Java dates, so the toDate() method is called to convert from Joda DateTime instances to the Java Date class. finally the metric name is added to the query.

The next bit of code has 3 nested for loops. This may seem overkill, but the KairosDB API allows for multiple queries per call to KairosDB, and for the moment we only have the one metric, so have to dig through several data structures to get the data returned from the backend database.

And there you have it. A quick and easy web interface to graph the time series data.

I plan on continuing to expand the Relay to give new functionality. Not every change I make will become a blog post, so you might want to keep an eye on the Github project if you find this interesting and want to be kept aware of the changes. At some point I want to be able to pull the data into the data analysis package R and eventually do machine learning from the data, I will probably end up writing posts about those things.


Monday, November 23, 2015

Sensor Data To The Cloud: Part 1

I have been experimenting with sensing data in my home and storing that data in the cloud. This is a project in progress and I thought I would write about it as all of the pieces come together. This series will discuss

  1. capturing sensor data, in this case temperature and light level data, on a Raspberry Pi,
  2. communicating the sensor data to the cloud over MQTT
  3. storing the data in a time series database on the cloud server
  4. providing access to that data
Step 4 will be done in the second blog post.

Do be aware, there are a LOT of steps here to get everything configured. For some of you, this may all go quickly, for others it will seem like a lot and perhaps get a bit confusing because of all the steps, some will handle some parts quickly and other parts not so quickly. If you have trouble with any of the pieces, see if you can find someone who understands those pieces to help you out. Also, for some things, the online documentation is good, for instance creating a Google Compute Engine instance, so I won't be going into details there.

There will also be links to github repos containing all of the code written by me.

This post has several major sections. The first will be about setting up the cloud server, including the installation of all needed software. The second section will talk some about how I actually went about figuring out how to do all of this stuff, as the post presents it in an order better suited to giving step by step instructions rather than the messy process of figuring out what the step by step process is. The final section shows the sensor circuit used with the Raspberry Pi and how to configure the Pi to get the data to the cloud.

And with that, let's get started!

Setting Up The Cloud Instance


We'll start with the cloud side first.

The first thing I did was obtain and setup a Google Compute Engine instance. You can find more details about that here: https://cloud.google.com/compute/. I won't give the complete details of every step that I went through to create the instance as the online documentation is good, but will list some of the highlights.

  1. The image on the machine is a Linux instance running Debian Jessie
  2. It has a static IP address that I connected to the domain name smartspaces.io
  3. I used the Metadata > SSH Keys tab on the Google Developer's Console to install an SSH key created on my laptop so that I could ssh and scp content from my laptop into the instance without a password
  4. The cloud instance by default only opens the firewall for HTTP ports, but network ports for MQTT and for a non-standard HTTP port for an AJAX call are necessary

Opening Network Ports


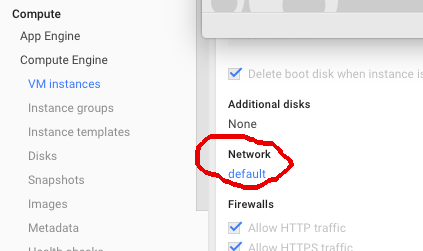
It is necessary to open up a couple of network ports to allow MQTT and non-standard HTTP AJAX traffic. To open these ports you will need to go to your VM Instance in the Google Developer's console for your Compute Engine instance and click the default link under Network. You can see this area circled below.


This will take you to the network page. Click on Add Firewall rule to add in the MQTT port. It is the blue button in the image below.


You will see a window that looks like this


I set the Name to MQTT and the Description is MQTT Ports.

Under Allowed Protocols and Ports, I put tcp:1883; tcp:8883.

Everything else I left alone.

I also created a firewall rule for accessing the web server that provides the time series data. This is different than the web server on the instance, though I could configure the existing web server to direct traffic to the time series web server. This is more detail than we want to worry about here, so just creating a second web server port keeps it easy.

For the timeseries web server, I set the Name to Web Timeseries. The Description is Timeseries HTTP Ports.

Under Allowed Protocols and Ports, I put tcp:8095.

Everything else was left alone.

If you were doing this for real, you would probably want some sort of authentication for accessing the timeseries web server, but we won't worry about that here.

Installing Cloud Software


There are a few pieces of software that need to be installed on the cloud instance. These will help with the later installations.

$ sudo apt-get install update-rc.d
$ sudo apt-get install unzip

Installing MQTT


The MQTT server I chose was from the Moquette project. You can get details of the project and download the software from http://andsel.github.io/moquette/.

I placed the software in the /opt/moquette folder of the Google Compute Engine instance.

The config/moquette.conf file was modified as follows. I will give the lines that I changed and the value that I gave them.

The allow_anonymous property will either allow or prevent just anyone from using your broker. We will set it to not allow anonymous logins so that clients will need to log into the broker to use it. All of the sample code on the github links provide login into the broker.

allow_anonymous false

Since the broker does not allow anonymous connections any more, you will need a user name and password. Moquette's password are coded as SHA256 hashes. Say you want to create a user named keith and have a password of yourpassword. First get the SHA256 hash of yourpassword. I ran the following command on the Google Compute Engine instance.


$ echo -n "yourpassword" | sha256sum
e3c652f0ba0b4801205814f8b6bc49672c4c74e25b497770bb89b22cdeb4e951  -

That really long string after the echo command is the SHA256 hash of the password. The hash does not include the - on the end. Now that you have the password hash, you need to edit the file config/password_file.conf. This file can contain as many lines as you want, one line for each different user name and its associated password.


keith:e3c652f0ba0b4801205814f8b6bc49672c4c74e25b497770bb89b22cdeb4e951

I do recommend that if you are using this blog that you do not make your password yourpassword as people may see that password here and try it first.

Now we need to make sure that Moquette will start running every time your cloud instance reboots.

You have a choice here of using init.d scripts or Upstart. Upstart is the default system on Ubuntu instances, whereas Debian by default uses init.d. You can get the startup scripts here as well as directions on how to make them work: https://github.com/kmhughes/robotbrains-system/tree/master/messaging/mqtt/moquette.

Installing Cassandra


The backend database for the timeseries data is the Apache project Cassandra.

Installing Cassandra is fairly easy. First you add in the location of the Cassandra packages to the Debian package manager, and then make sure Cassandra will be autostarted when the machine reboots.

First let's get the Cassandra repository location added to the Debian package manager.

$ sudo nano /etc/apt/sources.list.d/cassandra.list

The contents of cassandra.list will be

deb http://www.apache.org/dist/cassandra/debian 21x main
deb-src http://www.apache.org/dist/cassandra/debian 21x main

Now let's get Cassandra installed.

$ gpg --keyserver pgp.mit.edu --recv-keys F758CE318D77295D
$ gpg --export --armor F758CE318D77295D | sudo apt-key add -
$ gpg --keyserver pgp.mit.edu --recv-keys 2B5C1B00
$ gpg --export --armor 2B5C1B00 | sudo apt-key add -
$ gpg --keyserver pgp.mit.edu --recv-keys 0353B12C
$ gpg --export --armor 0353B12C | sudo apt-key add -
$ sudo apt-get update
$ sudo apt-get install cassandra cassandra-tools

All of the gpg commands only need to be done once and tells your local machine to trust the Cassandra repositories. 

Once Cassandra is installed, you should tell the operating system to automatically start Cassandra when the machine reboots. While you are at it, you should also start the service so you can continue with the instructions here.

$ sudo /usr/sbin/update-rc.d cassandra defaults
$ sudo service cassandra start

Installing KairosDB


Now we need to provide an easy way to store time series data into Cassandra and retrieve the data. The package we will use is KairosDB.

You can find out details about KariosDB at https://github.com/kairosdb/kairosdb. This site has links to the documentation on how to use KairosDB if you are interested in learning how to use it yourself rather than just using the code I will provide.

It is easiest to install KairosDB by getting the Debian package.

$ wget https://github.com/kairosdb/kairosdb/releases/download/v1.0.0/kairosdb_1.0.0-1_all.deb
$ sudo dpkg -i kairosdb_1.0.0-1_all.deb

You will then find KairosDB in /opt/kairosdb.

We now need to modify config/kairos.properties so that we change the web port to use for accessing the data and so that it uses the correct backend database.

By default, KairosDB exposes its web server port at 8080. This conflicted with a regular web server running on my server, so I decided to change the port to 8090. Look for the line

kairosdb.jetty.port=8080

Now change the value on the end to 8090.

kairosdb.jetty.port=8090

By default, KairosDB uses H2 as its backend database. We need to change it so that it uses Cassandra. Look for the following line

kairosdb.service.datastore=org.kairosdb.datastore.h2.H2Module

Put a # at the beginning of this line so it looks like

#kairosdb.service.datastore=org.kairosdb.datastore.h2.H2Module

Now look for the line like the following

#kairosdb.service.datastore=org.kairosdb.datastore.cassandra.CassandraModule

and change it to

kairosdb.service.datastore=org.kairosdb.datastore.cassandra.CassandraModule

Save the file.

Now start KairosDB. It will automatically connect to Cassandra and create all necessary tables.

$ sudo service kairosdb start

The KairosDB Cassandra tables need to be modified from the defaults that KairosDB creates them with. First, start up the Cassandra command line shell.

$ cqlsh

After the shell is running, type the following commands. Everything before the > is the prompt that cqlsh is giving you, you should type everything after the >.

cqlsh> use kairosdb;
cqlsh:kairosdb> alter columnfamily data_points with read_repair_chance = 0.1;
cqlsh:kairosdb> alter columnfamily row_key_index with read_repair_chance = 0.1;
cqlsh:kairosdb> alter columnfamily string_index with read_repair_chance = 0.1;

If the KairosDB namespace is not available, (you would see an error like InvalidRequest: code=2200 [Invalid query] message="Keyspace 'kairosdb' does not exist" if it doesn't exist) then KairosDB is not connecting properly to Cassandra. Look at the logs in the terminal window for information, perhaps you don't have a port set correctly for contacting Cassandra, or perhaps KairosDB's network ports clash with another port being used on your Compute Engine instance. You might also have forgotten to change KairosDB from using H2 to Cassandra for its database.

Installing the Data Relay Server


OK, hopefully by now you have the MQTT broker, Cassandra, and KairosDB running. However, now the MQTT broker needs to talk to KairosDB to store your data in Cassandra. For this I have implemented the Data Relay Server. This server has an MQTT client that will receive data from the Raspberry Pi and then call KairosDB to ultimately store the data in Cassandra.

You can find the code for the Data Relay Server on github:
    https://github.com/kmhughes/robotbrains-examples/tree/master/data/cloud/org.robotbrains.data.cloud.timeseries.server

You can find a zipped version of the server on Google Drive: 
    https://drive.google.com/file/d/0BxZiP9lENIZjbEZqM2d5dmRmdW8/view?usp=sharing

For now, download the Relay from Google Drive and unzip it in your home folder on the Compute Engine instance. It will eventually be placed in /opt, but for now let's just have it running if you are logged into the Compute Engine instance.

Now you need to create a YAML file that will contain some configuration properties for the Data Relay Server. Here is a sample file I called smartspacescloud.yaml.

mqtt.server.host: smartspaces.io
mqtt.server.port: 1883

mqtt.username: keith
mqtt.password: yourpassword

smartspaces.cloud.timeseries.topic.incoming: /smartspaces/cloud/timeseries/incoming
smartspaces.cloud.timeseries.node.name: /smartspaces/cloud/timseries/relay/server

database.kairosdb.connection.host: localhost
database.kairosdb.connection.port:8090

The first two properties set the host and port of the MQTT server that is being used to transfer your sensor data. Notice here it is pointing at my MQTT server. I am using the standard MQTT port. The values should match those for your server.

The next two properties give the user name and password you set up for your MQTT server account. Notice here the password is not given as its SHA256 hash, it is in plaintext.

The next two properties specifies the MQTT topic that the sensor data will be transferred on and how the MQTT client identifies itself.

The Data Relay Server will subscribe to the specified topic to receive the MQTT data from the Raspberry Pi, whereas the Raspberry Pi will be a publisher on this topic to send the data. Pick a name meaningful to you, here the name /smartspaces/cloud/timeseries/incoming was chosen to be self documenting, this is the SmartSpaces topic for timeseries data coming into the cloud. If you wanted, you could call it something like /foo/bar, but after you have a bunch of topics, it might then be hard to know what they are actually being used for if you use names like /foo/bar.

The node name should also be meaningful, here /smartspaces/cloud/timseries/relay/server. Notice that my Relay instance that runs on the Compute Engine instance ends with server. The instance I run on my laptop for debugging ends in laptop.

The final two properties specify which KairosDB instance the Server should talk to. The values supplied should be fine unless you changed the port that KairosDB listens on or placed it on another machine. If so, change the values accordingly.

You will make a file very similar to this one on your Raspberry Pi as well so you have the same information on both sides as both the Data Relay Server and the Raspberry Pi are MQTT clients, even though one is a subscriber to the data and one is a publisher. The copy on the Raspberry Pi can delete the two lines about KairosDB since you won't be running KairosDB on the Pi.

Say you unzipped the Data Relay Server and stayed in the folder that you unzipped the server into. You can start the server by typing

$ org.robotbrains.data.cloud.timeseries.server/bin/org.robotbrains.data.cloud.timeseries.server -c smartspacecloud.yaml

You should see a bunch of logging information going by telling you that everything is working. If not, double check your configuration parameters.

Now let's install the Relay in its final home. Move the server directory to /opt. Once it is there then copy your configuration file into the config folder. Finally copy the systemd file that will start the Server on machine boot into the proper system folder and enable it and then start it running.

$ sudo mv org.robotbrains.data.cloud.timeseries.server /opt/robotbrainsclouddataserver
$ sudo mv smartspacecloud.yaml /opt/robotbrainsclouddataserver/config
$ sudo cp /opt/robotbrainsclouddataserver/bin/robotbrainsclouddataserver.service /etc/systemd/system
$ sudo systemctl enable robotbrainsclouddataserver.service
$ sudo systemctl start robotbrainsclouddataserver.service

If you have everything set up correctly, you should output appearing in 
/var/log/robotbrainsclouddataserver/robotbrainsclouddataserver.log telling you that the Relay Server has started.

The Server has a bunch of pieces and explaining them all in detail would take a lot of room, but let's look at the highlights.

Start with ServerMain and see how it pulls the server pieces together.

To understand the Raspberry Pi to Database Relay communication, look at the PahoMqttRemoteDataRelay class. Its  startup() and shutdown() methods show how to connect to and disconnect from the MQTT broker. JSON messages are used to encode the data between the Pi and the Relay, you can see the details starting from the handleMessageArrived() method.

To see how data is transferred into KairosDB, look at the KairosDbDatabaseRelay class. The startup() and shutdown() methods show how to set up and shut down communication with KairosDB. The processSensorData() method takes data being transferred from the MQTT client and sets up the data structures needed to transfer it to KairosDB.


The Server Is Done!


Wow, that was a lot of work! But now you have your server configured, though it isn't doing anything yet but sitting there patiently waiting for your data.

While I wrote the software I did things very differently so I could test things as I went along. Here were my steps, more or less, in case you're curious about my approach,.

First I installed Moquette on the Compute Engine instance. I then wrote an MQTT publisher and an MQTT subscriber in Java and ran both on my laptop, making sure I could get roundtrip data. You can see my test clients here: https://github.com/kmhughes/robotbrains-examples/tree/master/comm/mqtt

I then wrote the beginnings of the MQTT publisher in Python and made sure I could have the Python publisher write any sort of data whatsoever to the Java subscriber. In fact, I had it write Hello, World, which is the time-honored first message that any program should send. The publisher was then copied to a Raspberry Pi to confirm I could get data from a Pi to the Java subscriber on my laptop.

Next was building the circuit for the Raspberry Pi and writing a small Python program to read the data from the sensors.

The sensor reading Python program was then combined with the MQTT publisher Python program and cleaned up. The data format was decided. I then checked that the newly combined sensor publisher Python program could send data to my Java subscriber.

I then took that Java subscriber and copied it into a new project and started creating the Data Relay Server.

Next I installed Cassandra and made sure I could connect to it with csqlsh. Once I knew that worked, I installed KairosDB and configured it so that it could talk to Cassandra. That took a couple of tries, but I was finally able to see the Cassandra namespace for KairosDB.

Next I took my nascent Relay Server and made it place random data into KairosDB. Once I saw the fake data successfully going in, I tried reading the fake data out.

Finally I connected the Kairos component of the Data Relay Server to the MQTT client in the Server and tested whether data went in and whether I could query it.

It was a lot of steps, but it meant at each step I understood that piece and knew it worked before I added in another step. If I had tried everything all at once it would have been VERY difficult to debug. It also meant I could really learn how to use each component in isolation. Trying to write everything all at once when not understanding any of the pieces would have been very hard.

Setting Up Your Raspberry Pi


I am using a Raspberry Pi 2 for this project. If you are not using a Pi 2, these directions may or may not work, I have not tested them on a Pi 1.

To keep things simple, let's use Python on the Raspberry Pi to access the sensors and send data to the cloud.

I tried using the Ubuntu installation for the Pi but had problems getting the Python library for accessing the Pi GPIO pins to work, so gave up and switched to Raspbian.

Python uses a package called pip to install Python packages. If you don't already have pip installed, you can install it with the following commands, depending on whether you use Python 2 or Python 3.

$ sudo apt-get install python-pip
$ sudo apt-get install python3-pip

You now need to install a variety of Python packages used by the sample code.

$ sudo apt-get install python-dev
$ sudo pip install rpi.gpio
$ sudo pip install pyyaml
$ sudo pip install paho-mqtt

If you are using Python 3, replace pip in the above commands with pip3.

Wiring


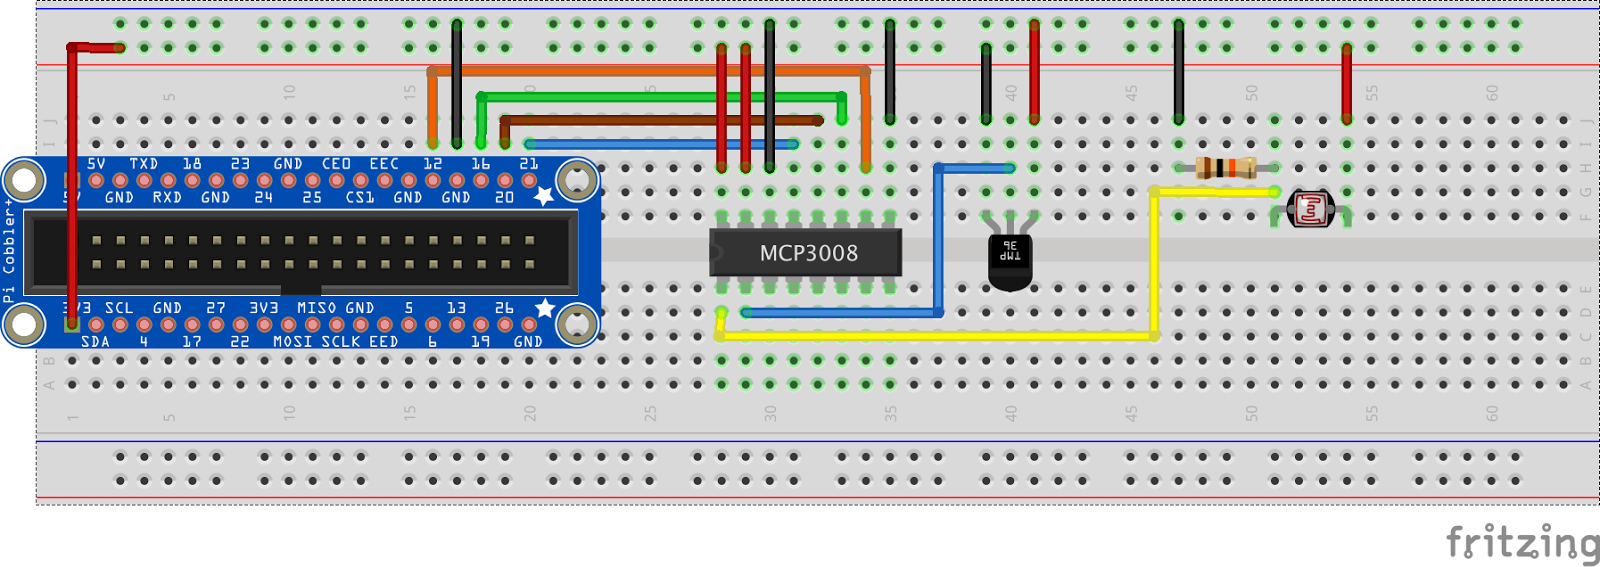
I chose to measure temperature and light levels in this post to keep things simple. I used a TMP36 for reading the temperature as it gives a very simple analog signal linear in the temperature being sensed. The light level was measured with a photoresistor, also giving an analog signal.

The Raspberry Pi does not come with analog to digital converters, so if you want to read analog signals, you will need an external A/D converter. I chose the MCP3008 A/D converter which gives an SPI interface for reading the analog data. I will not be describing the SPI protocol in this post, perhaps a later one, but there are good articles online if you want to Google them.

The complete circuit is given below. The resistor is a 10k, the photoresistor was just something I had in the house, I think its highest resistance was around 10k. And that big blue thing on the left side is a Raspberry Pi 2 Cobbler. The Cobblers make it really easy to breadboard with a Raspberry Pi, I recently bought a lot of them.

First the Fritzing diagram.


The following pictures show a bit of a rat's nest of wiring, the Fritzing will make things much more clear.


And with the Pi...


I am leaving this on a large breadboard in case I want to add more sensors to it over time.

The Python Program


The Python program can be found on github at https://github.com/kmhughes/robotbrains-examples/tree/master/data/cloud/org.robotbrains.data.cloud.timeseries.client.

Copy the files robotbrainsclouddataclient.py and robotbrainsclouddataclient to your /home/pi directory.

Now we need to have the client know about the MQTT broker in the cloud and what topics to publish on. Create a file called smartspacescloud.yaml and place the following contents in it

mqtt.server.host: smartspaces.io
mqtt.server.port: 1883

mqtt.username: keith
mqtt.password: yourpassword

smartspaces.cloud.timeseries.topic.incoming: /smartspaces/cloud/timeseries/incoming

The properties here should match the properties in the Data Relay Server's smartspacescloud.yaml. If you don't get them correct, the Data Relay Server will not get the data from your Pi. The host and port values should match the host and port for your MQTT server on your cloud instance.

Now let's try your client and see if you get data in the cloud. But first, let's see if we get any data at all. The Python program is initially configured to not contact the cloud and to write out sensor data every 5 seconds on the console.

Run the following commands on your Pi.

sudo ./robotbrainsclouddataclient.py smartspacescloud.yaml

The sudo is necessary as you can only access the GPIO pins on the Pi as the root user.

If you have wired everything properly, you should see sensor measurements being printed every 5 seconds on the Pi. If you don't see anything, check that your circuit is wired properly. If you do see data being printed, type ^C to end the program.

If your circuit worked, let's get data to the cloud.

On the cloud instance type the following command. This will let you see log output as it is written into the logs.

$ tail -f /var/log/robotbrainsclouddataserver/robotbrainsclouddataserver.log 

Now open the Python script in your favorite editor and look for the line where the variable CONNECT is set equal to 0. Change the 0 to 1 and run the program again.

If you have connected everything properly, you should see sensor measurements coming into your cloud server every 5 seconds. If you don't see anything, make sure you have the same MQTT server connection information in the smartspacescloud.yaml files on both machines and that the MQTT topic is the same on both sides.

Measurements every 5 seconds might be a bit much, I have my instance reading the sensors every 10 minutes. Once again, open up the Python script in your favorite editor. Change the value of DEBUG from 1 to 0 to stop debugging output and change SAMPLING_PERIOD to how many seconds you want between sensor measurements. As I said, I record measurements every 10 minutes so set the sampling period to 600.

 We would like the Data Client to run whenever the Pi boots. To do so, copy robotbrainsclouddataclient from /home/pi to to /etc/init.d. Then type the following command so that the Pi knows to run this script every time it boots.

$ update-rc.d robotbrainsclouddataclient defaults


The Python script has 5 major sections.

The first contains various parameters like DEBUG, CONNECT, and SAMPLING_PERIOD that are used and which pins the sensors are attached to on the A/D converter chip.

The second section contains code from the folks at Adafruit for communicating with the A/D chip. It uses a technique called bit-banging, where the SPI signals are generated by turning digital pins on and off and reading digital pins, rather than using specialized pins and processor instructions that handle things like the SPI clock for you.

The next section creates a handler for the MQTT client for handling data connections and also sets up a handler to detect when a kill signal is sent to the script. The handler will shut down the MQTT client and perform any other needed cleanups.

The 4th section reads the configuration file and sets up the MQTT client.

The final section creates a loop that will read the sensor signals, format them into a JSON message, and then send them over the MQTT channel to the Data Relay for storage into the time series database.

Done For Now!


If you made it through everything, you are now reading sensor signals on your Raspberry Pi and storing them in a time series database in the cloud. As I said before, this is a lot of steps, so if it isn't working, find people you know who understand the pieces that aren't working and see if they can help.

Now that we have data going into the database, we need to get it out of the database so we can process it. I will soon be writing the code that allows queries for reading the data, uploading it to github and then write another post on how reading the data works.

Until next time...


Saturday, July 4, 2015

Greenhouse: Phase 3, Sensors Working

It has been a while since I posted, but a lot has been going on.

As far as this project is concerned, the barometer ended up being a real pain. I was using the Adafruit MPL3115A2 breakout board and, as you can see from the previous post, I tied it in on the same I2C bus as one of the AM2315 Temperature and Humidity Sensors on the DUE. I modified the Adafruit library for the MPL3115A2 in the same way I modified the AM2315 to work on any I2C bus I want it to and fired everything up.

Nothing. Not a peep from the sensor.

I tried it on the second I2C bus.

Nothing.

Now that's annoying. I checked the wiring a bunch of times, checked my code, and yet... nothing.

I then dug out an Arduino UNO to try it out on and everything worked perfectly.

I wrote a post on the forums at Adafruit to see if anyone had any ideas. Someone else tried the MPL3115A2 on a DUE and also never got it to work. So I went over to Sparkfun and bought their same board. I know, kinda silly, but I was hoping it was something about the Adafruit board and that the Sparkfun board would just work. But no, it was not to be and the Sparkfun board remained silent on the DUE. Ultimately the folks at Adafruit decided that something was odd about the DUE I2C libraries just for the barometer board, perhaps a timing issue or something, even if it was working with the temperature/humidity sensors.

Poking around, I found the Teensy 3.1 has 2 I2C buses so gave it a try. Everything worked the first time, though the Teensy libraries do not use the I2C interfaces from twi.h, and I found they had their own I2C library called i2c_t3. So much for uniform library naming.

My final modifications for the Adafruit libraries for the AM2315 and the MPL3115A are found here and here, respectively.

Here is a picture of the final breadboard. I am leaving it as a breadboard for the next year in case I want to add in other sensors. I left it with the Sparkfun barometer board, which is on the right. The left side is the Teensy 3.1.


Below is the Fritzing diagram of the circuit. I couldn't find a part that shows the pins on the underside of the Teensy so just drew the wires with a note to label them. You can see the wires coming out from under the Teensy on its right side in the above picture.


My Arduino sketch is still not sending the binary data to the host processor, but here is the current code.


#include <i2c_t3.h>
#include <Adafruit_AM2315.h>
#include <Adafruit_MPL3115A2.h>

// The inside AM2315 temperature and humidity sensor.
Adafruit_AM2315 am2315Inside(&Wire1);

Adafruit_MPL3115A2 barometric(&Wire1);


// The outside AM2315 temperature and humidity sensor.
Adafruit_AM2315 am2315Outside(&Wire);

// The sensor data packet containing all data to be transmitted
// to the host.
typedef struct _SenseData {
  float temperatureInside;
  float humidityInside;
  float temperatureOutside;
  float humidityOutside;
  float altitude;
  float barometricPressure;
  float barometicTemp;
} SenseData;;

SenseData senseData;

void setup() {
  Serial.begin(9600);
}

void loop() {
 if (am2315Outside.begin()) {
    am2315Outside.readTemperatureAndHumidity(senseData.temperatureOutside, senseData.humidityOutside);
    Serial.print("Outside Hum: "); Serial.println(senseData.humidityOutside);
    Serial.print("Outside Temp: "); Serial.println(senseData.temperatureOutside);
  } else {
    Serial.println("Cannot see outside AM2315");
  }

  if (am2315Inside.begin()) {
    am2315Inside.readTemperatureAndHumidity(senseData.temperatureInside, senseData.humidityInside);
    Serial.print("Inside Hum: "); Serial.println(senseData.humidityInside);
    Serial.print("Inside Temp: "); Serial.println(senseData.temperatureInside);
  } else {
    Serial.println("Cannot see inside AM2315");
  }
 
  if (barometric.begin()) {
    senseData.barometricPressure = barometric.getPressure();
    Serial.print(senseData.barometricPressure/3377); Serial.println(" Inches (Hg)");

    senseData.altitude = barometric.getAltitude();
    Serial.print(senseData.altitude); Serial.println(" meters");

    senseData.barometicTemp = barometric.getTemperature();
    Serial.print(senseData.barometicTemp); Serial.println("*C");
  } else {
    Serial.println("Couldnt find barametric sensor");
  }

  delay(1000);
}

You may notice the conditionals inside the loop that are constantly calling the begin() method for the sensor. I did this so that if a physical sensor is removed, the other sensors can continue to report their data. The else section will probably set those fields to minus infinity or NaN if the sensor is not read.

When I am finally ready to send this to the host computer, I will use a line like

Serial.write(&senseData, sizeof(senseData);

This line will send out the packet with the data in the order that the fields are defined in the structure SenseData above.

In the next installment of the Greenhouse Saga, I will show the Java end that will read the data from the sensor and place it in an Interactive Spaces activity.


Tuesday, May 5, 2015

Greenhouse Phase 2: Temperature and Humidity Sensors

The next phase of the greenhouse is to add some sensors to the mix. The initial round will be for measuring temperature and humidity both inside and outside of the greenhouse and measure windspeed outside the greenhouse. Windspeed measurements in the greenhouse would hopefully be pretty boring data, except perhaps if someone left the door open.

The greenhouse was initially meant to be mostly underground, what is called a walipini, but as they were digging they hit bedrock rather soon. If we had done that we would have had a reasonably temperature constant greenhouse as the temperature stays reasonably constant when underground. Instead we ended up with a climate battery. The concept here is to pump heat into the ground during the day when it is warm, or at least not too cold, and heat up the ground, and then release that heat back into the greenhouse at night. This is accomplished by having a fan that blows air into a series of tubes buried in the ground of the greenhouse.

I am very curious to see how well the climate battery works, so want to capture temperature and humidity data for a few weeks with the climate battery off and then turn it on and see how much the temperature and humidity profiles smooth out.

After some searching, I decided to use the AM2315 temperature and humidity sensor from Adafruit. The sensor comes in a case that protects the inside sensors. The description on Adafruit says that it isn't really rated for being outdoors, but I have read about a lot of people using them that way so I will give it a try.

One immediate complication is that the AM2315 is an I2C device. For those unfamiliar with I2C, this is a two wire protocol for communicating with a series of devices on a serial bus, one wire for a clock and a second wire for data. Each I2C device has an address and you can read or write to the devices by giving the address of the device you want to read or write from. Unfortunate the AM2315 has a fixed I2C address (0x5C), so if you want to use 2 of them, you need 2 independent I2C buses.

My initial design used 2 Arduino Unos, once for each AM2315. I am using Arduinos for now as I want to experiment over time with which sensors I am going to use and want to be able to easily throw in other sensors on a breadboard. Then, at some point in the future, I can built something a little more permanent. 2 Arduinos means 2 USB ports to get the data out to a host for processing, so I decided after a while to go with the Arduino DUE, which is the only Arduino with 2 I2C buses on it.

I got the Adafruit AM2315 from its git repository at https://github.com/adafruit/Adafruit_AM2315 and wired the AM2315 to the I2C bus at pins 20 and 21 on the DUE. A quick check and everything was working just fine.

That second AM2315 ended up being more of an issue. The Adafruit library only supports the I2C bus on pins 20 and 21 and I wanted to use the code on both buses. I took a look at the source of the library and found that the Wire instance variable was hardcoded directly into the AM2315 code, so modified it to allow the user to specify which bus to use.

The initial class definition in Adafruit_AM2315.h had

class Adafruit_AM2315 {
 public:
  Adafruit_AM2315();

and I changed it to

class Adafruit_AM2315 {
 public:
  Adafruit_AM2315(TwoWire* w=&Wire);

This allows the usage Adafruit_AM2315 foo() to still go with Wire, but I can now also specify if I want Wire or Wire1, though with a slightly more complicated syntax.

I also needed to add a private instance variable of TwoWire* wire to the class definition.

Adafruit_AM2315 foo(&Wire1);

This required some changes to the Adafruit_AM2315.cpp code, I did a replacement of Wire. to wire-> throughout the source and modified the Adafruit AM2315 constructor from


Adafruit_AM2315::Adafruit_AM2315() {
}

to

Adafruit_AM2315::Adafruit_AM2315(TwoWire *w): wire{w} {
}

You can find the modified library at my github repo https://github.com/kmhughes/Adafruit_AM2315.

The circuit for both AM2315s, the anemometer, and a barometric pressure sensor (which should be ignored for now) is as follows.


Note the 10k pullup resistors on the I2C lines, the Arduino will not see the AM2315s if these resistors are missing.

The Arduino code to read the sensors is


#include <Wire.h>
#include <Adafruit_AM2315.h>
#include <Adafruit_MPL3115A2.h>

// The inside AM2315 temperature and humidity sensor.
Adafruit_AM2315 am2315Inside(&Wire);

// The outside AM2315 temperature and humidity sensor.
Adafruit_AM2315 am2315Outside(&Wire1);

// The sensor data packet containing all data to be transmitted
// to the host.
typedef struct {
  float temperatureInside;
  float humidityInside;
  float temperatureOutside;
  float humidityOutside;
  int windSpeed;
} SenseData;

SenseData senseData;

void setup() {
  Serial.begin(9600);

  if (! am2315Outside.begin()) {
     Serial.println("Outside AM2315 sensor not found, check wiring & pullups!");
     while (1);
  }

  if (! am2315Inside.begin()) {
     Serial.println("Inside AM2315 sensor not found, check wiring & pullups!");
     while (1);
  }
  
  // TODO(keith): initialize barametric sensors
}

void loop() {
  am2315Outside.readTemperatureAndHumidity(senseData.temperatureOutside, senseData.humidityOutside);
  am2315Inside.readTemperatureAndHumidity(senseData.temperatureInside, senseData.humidityInside);

  senseData.windSpeed = analogRead(0);
  
  // TODO(keith): Remove when sending data to host
  Serial.print("Outside Hum: "); Serial.println(senseData.humidityOutside);
  Serial.print("Outside Temp: "); Serial.println(senseData.temperatureOutside);
  Serial.print("Inside Hum: "); Serial.println(senseData.humidityInside);
  Serial.print("Inside Temp: "); Serial.println(senseData.temperatureInside);

  Serial.print("Wind Speed: "); Serial.println(senseData.windSpeed);
  
  // TODO(keith): Write data to host computer
  
  // TODO(keith): change sample rate to every 5 minutes or so
  delay(1000);
}

Here you can see that the inside AM2315 is on the first I2C bus on pins 20 and 21 and the outside AM2315 is on the additional bus. The anemometer is connected to analog 0 on the Arduino.

You may wonder why am I using a struct to store the sensor data? As you will see, once the code is complete, this will make it very easy to write all of my sensor data in a single line to the host computer. But for now I am debugging, so will leave the Serial prints in and have the code look annoyingly complicated.

This code can be found at https://github.com/kmhughes/robotbrains-smartspaces/blob/master/arduino/GreenhouseSensors/GreenhouseSensors.ino

One thing I discovered is that even if the AM2315s are sitting physically next to each other, they give different temperature values. So I will have to calibrate them and subtract an offset from both values calculated from a known accurate sensor.

At the moment I cannot get the barometer, which is also an I2C device, working on the DUE though I did make it work on an UNO. Once I sort that out I will modify the code and post the host side that will be capturing the data and storing it for later graphing and analysis and show the wiring inside and outside the greenhouse.

Monday, May 4, 2015

The Jetson TK1 and the Caffe Deep Learning Project

I have been very interested in starting to use OpenCV for adding vision to my interactive space projects. I recently bought a Jetson TK1 DevKit to help me with this. The Jetson TK1 is a development board for the NVIDIA Kepler GPU, a GPU built for mobile platforms. The GPU has 192 CUDA cores, which meant that I could not only use an accelerated OpenCV for computer vision processing, I could also start experimenting with parallel programming on a GPU. The book CUDA By Example by Sanders and Kandrot has been very useful in learning how to program the cores, I imagine I will be talking more about learning how to program a GPU in future posts. The TK1 has OpenCV libraries available for it that take advantage of the CUDA cores and can do quite rapid image processing

The TK1 also has a quad core ARM Cortex processor for its main CPU, GPIO, I2C, SPI, and a ton of other features. Not bad for $192, or just $1 per CUDA Core.

Here is a picture of the board along with the solid state hard drive I attached to it.


There are easy to use instructions to get started with the TK1 at https://developer.nvidia.com/get-started-jetson. These instructions include how to flash the operating system. The site http://www.elinux.org/Jetson_TK1 includes a lot of great information, including how to install the CUDA libraries and how to install the CUDA accelerated OpenCV. The only thing I recommend is a reasonably fast Internet connection as some of the system components are quite large, for example you get the entire Ubuntu 14.04 system image to flash onto the board in one download.

One thing I am very interested in is starting to add much more intelligence to the interactive spaces I want to build.  I don't remember exactly how I found it, but I recently discovered the Caffe Deep Learning Framework open source project. You can get a lot of information about it at its website at http://caffe.berkeleyvision.org/. Deep learning is a machine learning technique that learns how to extract representations of data and then recognize pattern in those representations. These representations help recognize things like faces, or, as I saw in an ACM article today, solving the Cocktail Party problem. This problem is something many people are familiar with, you are at a party, or some other place with lots of people, and you can tune out everyone else's voices and hear just one conversation. This has been a very hard problem for computers to solve, but deep learning systems have made it possible.

Caffe supplies a general framework for deep learning. It comes with a series of models for doing object recognition in images and I hope to find it useful in a variety of other deep learning tasks.

When I installed CUDA on my TK1 I got version 6.5. The standard installs in the instructions from the above web sites gave be version 4.8 of the Gnu C and C++ compiler.

To install Caffe I first installed the following dependencies:

sudo apt-get install libprotobuf-dev protobuf-compiler gfortran \
libboost-dev cmake libleveldb-dev libsnappy-dev \
libboost-thread-dev libboost-system-dev \
libatlas-base-dev libhdf5-serial-dev libgflags-dev \
libgoogle-glog-dev liblmdb-dev


Next I installed the Caffe source. If you don't have it already, first install git.

sudo apt-get install -y git

After git is installed, create a directory where you want to install Caffe.

git clone https://github.com/BVLC/caffe.git
cd caffe

git checkout dev
cp Makefile.config.example Makefile.config


Now you can build Caffe.

make -j 8 all

Once the build is complete, it is a good idea to run the tests and make sure your install worked. This worked for me the first time, so it seems hard to screw it up.

make -j 8 runtest


If all the tests pass, you can then run the timing tests.

build/tools/caffe time --model=models/bvlc_alexnet/deploy.prototxt --gpu=0

The -gpu=0 at the end tells the code to run the tests on the GPU. The command

build/tools/caffe time --model=models/bvlc_alexnet/deploy.prototxt

will run it on the CPU of your computer, not the GPU.

 The test runs over 10 different versions of the image per pass, so to figure out how much time was taken for an image recognition per image, look at the 'Average Forward pass' time and divide by 10.

On the TK1, I found  approximately 25 msec per image on the GPU, while on the CPU I got 602 msec per image. Quite the difference.

Next I am trying to get the NVIDIA cuDNN library working with CAFFE. I have version 2 of the cuDNN library and apparently that means I need to follow special instructions to get Caffe to use it.

But once I get it compiled in, I will start figuring out how to create my own deep learning neural network models and will write about how that goes.


Saturday, April 25, 2015

Greenhouse Phase 1: Solar Power

We had a greenhouse built for us in the early months of this year. The plan is to ultimately build an aquaponics system in it that will be as automated as I can make it, hence why I am discussing it in this blog. My next post will be about the sensors I am building for measuring temperature and humidity both inside and outside the greenhouse. The greenhouse has a climate battery in it and I am very curious to see exactly how much it modifies the temperature profile throughout the day. Once the sensor array is in I will measure the temperatures for a couple of weeks without the climate battery, and then 2 weeks with the climate battery.

Step 1 of the project was to put in a small solar array to power the greenhouse.

For now the panels are just leaning on the outside of the greenhouse. Eventually, when I decide how many total I want, I will mount them on more permanent structures. Obviously they shouldn't stay on the windows, they will block the light.

Each panel outputs a maximum of 100 watts at 12 volts. They are tied together in parallel to give 12 volts at 200 watts.


For now I am working with just two batteries. Each is 12 volts and they are wired in parallel. The box on the left is a power inverter that takes the 12 volt DC and converts it to 110 volts AC.


Also do excuse the wire mess. It will not stay that way, but until the greenhouse layout is complete with the aquaponics system I don't want to be shortening wire lengths until I know where the wires will go.

The entire system is from Renogy and was bought on Amazon. For the most part I like the system, but I must admit, the charge controller feels like a piece of cheap crap and the wires do not feel that securely attached to it despite me tightening them down as much as I could.


OK, now on to attaching the I2C sensors to the Arduino Due...