I have been experimenting with sensing data in my home and storing that data in the cloud. This is a project in progress and I thought I would write about it as all of the pieces come together. This series will discuss
- capturing sensor data, in this case temperature and light level data, on a Raspberry Pi,
- communicating the sensor data to the cloud over MQTT
- storing the data in a time series database on the cloud server
- providing access to that data
Step 4 will be done in the second blog post.
Do be aware, there are a LOT of steps here to get everything configured. For some of you, this may all go quickly, for others it will seem like a lot and perhaps get a bit confusing because of all the steps, some will handle some parts quickly and other parts not so quickly. If you have trouble with any of the pieces, see if you can find someone who understands those pieces to help you out. Also, for some things, the online documentation is good, for instance creating a Google Compute Engine instance, so I won't be going into details there.
There will also be links to github repos containing all of the code written by me.
This post has several major sections. The first will be about setting up the cloud server, including the installation of all needed software. The second section will talk some about how I actually went about figuring out how to do all of this stuff, as the post presents it in an order better suited to giving step by step instructions rather than the messy process of figuring out what the step by step process is. The final section shows the sensor circuit used with the Raspberry Pi and how to configure the Pi to get the data to the cloud.
And with that, let's get started!
Setting Up The Cloud Instance
We'll start with the cloud side first.
The first thing I did was obtain and setup a Google Compute Engine instance. You can find more details about that here:
https://cloud.google.com/compute/. I won't give the complete details of every step that I went through to create the instance as the online documentation is good, but will list some of the highlights.
- The image on the machine is a Linux instance running Debian Jessie
- It has a static IP address that I connected to the domain name smartspaces.io
- I used the Metadata > SSH Keys tab on the Google Developer's Console to install an SSH key created on my laptop so that I could ssh and scp content from my laptop into the instance without a password
- The cloud instance by default only opens the firewall for HTTP ports, but network ports for MQTT and for a non-standard HTTP port for an AJAX call are necessary
Opening Network Ports
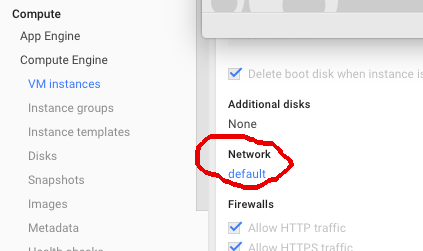
It is necessary to open up a couple of network ports to allow MQTT and non-standard HTTP AJAX traffic. To open these ports you will need to go to your VM Instance in the Google Developer's console for your Compute Engine instance and click the default link under Network. You can see this area circled below.

This will take you to the network page. Click on
Add Firewall rule to add in the MQTT port. It is the blue button in the image below.
You will see a window that looks like this
I set the
Name to
MQTT and the
Description is
MQTT Ports.
Under
Allowed Protocols and Ports, I put
tcp:1883; tcp:8883.
Everything else I left alone.
I also created a firewall rule for accessing the web server that provides the time series data. This is different than the web server on the instance, though I could configure the existing web server to direct traffic to the time series web server. This is more detail than we want to worry about here, so just creating a second web server port keeps it easy.
For the timeseries web server, I set the
Name to
Web Timeseries. The
Description is
Timeseries HTTP Ports.
Under
Allowed Protocols and Ports, I put
tcp:8095.
Everything else was left alone.
If you were doing this for real, you would probably want some sort of authentication for accessing the timeseries web server, but we won't worry about that here.
Installing Cloud Software
There are a few pieces of software that need to be installed on the cloud instance. These will help with the later installations.
$ sudo apt-get install update-rc.d
$ sudo apt-get install unzip
Installing MQTT
The MQTT server I chose was from the Moquette project. You can get details of the project and download the software from
http://andsel.github.io/moquette/.
I placed the software in the
/opt/moquette folder of the Google Compute Engine instance.
The
config/moquette.conf file was modified as follows. I will give the lines that I changed and the value that I gave them.
The
allow_anonymous property will either allow or prevent just anyone from using your broker. We will set it to not allow anonymous logins so that clients will need to log into the broker to use it. All of the sample code on the github links provide login into the broker.
allow_anonymous false
Since the broker does not allow anonymous connections any more, you will need a user name and password. Moquette's password are coded as SHA256 hashes. Say you want to create a user named keith and have a password of yourpassword. First get the SHA256 hash of yourpassword. I ran the following command on the Google Compute Engine instance.
$ echo -n "yourpassword" | sha256sum
e3c652f0ba0b4801205814f8b6bc49672c4c74e25b497770bb89b22cdeb4e951  -
That really long string after the echo command is the SHA256 hash of the password. The hash does not include the - on the end. Now that you have the password hash, you need to edit the file config/password_file.conf. This file can contain as many lines as you want, one line for each different user name and its associated password.
keith:e3c652f0ba0b4801205814f8b6bc49672c4c74e25b497770bb89b22cdeb4e951
I do recommend that if you are using this blog that you do not make your password yourpassword as people may see that password here and try it first.
Now we need to make sure that Moquette will start running every time your cloud instance reboots.
Installing Cassandra
The backend database for the timeseries data is the Apache project Cassandra.
Installing Cassandra is fairly easy. First you add in the location of the Cassandra packages to the Debian package manager, and then make sure Cassandra will be autostarted when the machine reboots.
First let's get the Cassandra repository location added to the Debian package manager.
$ sudo nano /etc/apt/sources.list.d/cassandra.list
The contents of cassandra.list will be
deb http://www.apache.org/dist/cassandra/debian 21x main
deb-src http://www.apache.org/dist/cassandra/debian 21x main
Now let's get Cassandra installed.
$ gpg --keyserver pgp.mit.edu --recv-keys F758CE318D77295D
$ gpg --export --armor F758CE318D77295D | sudo apt-key add -
$ gpg --keyserver pgp.mit.edu --recv-keys 2B5C1B00
$ gpg --export --armor 2B5C1B00 | sudo apt-key add -
$ gpg --keyserver pgp.mit.edu --recv-keys 0353B12C
$ gpg --export --armor 0353B12C | sudo apt-key add -
$ sudo apt-get update
$ sudo apt-get install cassandra cassandra-tools
All of the gpg commands only need to be done once and tells your local machine to trust the Cassandra repositories.
Once Cassandra is installed, you should tell the operating system to automatically start Cassandra when the machine reboots. While you are at it, you should also start the service so you can continue with the instructions here.
$ sudo /usr/sbin/update-rc.d cassandra defaults
$ sudo service cassandra start
Installing KairosDB
Now we need to provide an easy way to store time series data into Cassandra and retrieve the data. The package we will use is KairosDB.
You can find out details about KariosDB at
https://github.com/kairosdb/kairosdb. This site has links to the documentation on how to use KairosDB if you are interested in learning how to use it yourself rather than just using the code I will provide.
It is easiest to install KairosDB by getting the Debian package.
$ wget https://github.com/kairosdb/kairosdb/releases/download/v1.0.0/kairosdb_1.0.0-1_all.deb
$ sudo dpkg -i kairosdb_1.0.0-1_all.deb
You will then find KairosDB in
/opt/kairosdb.
We now need to modify
config/kairos.properties so that we change the web port to use for accessing the data and so that it uses the correct backend database.
By default, KairosDB exposes its web server port at
8080. This conflicted with a regular web server running on my server, so I decided to change the port to
8090. Look for the line
kairosdb.jetty.port=8080
Now change the value on the end to
8090.
kairosdb.jetty.port=8090
By default, KairosDB uses H2 as its backend database. We need to change it so that it uses Cassandra. Look for the following line
kairosdb.service.datastore=org.kairosdb.datastore.h2.H2Module
Put a # at the beginning of this line so it looks like
#kairosdb.service.datastore=org.kairosdb.datastore.h2.H2Module
Now look for the line like the following
#kairosdb.service.datastore=org.kairosdb.datastore.cassandra.CassandraModule
and change it to
kairosdb.service.datastore=org.kairosdb.datastore.cassandra.CassandraModule
Save the file.
Now start KairosDB. It will automatically connect to Cassandra and create all necessary tables.
$ sudo service kairosdb start
The KairosDB Cassandra tables need to be modified from the defaults that KairosDB creates them with. First, start up the Cassandra command line shell.
$ cqlsh
After the shell is running, type the following commands. Everything before the > is the prompt that cqlsh is giving you, you should type everything after the >.
cqlsh> use kairosdb;
cqlsh:kairosdb> alter columnfamily data_points with read_repair_chance = 0.1;
cqlsh:kairosdb> alter columnfamily row_key_index with read_repair_chance = 0.1;
cqlsh:kairosdb> alter columnfamily string_index with read_repair_chance = 0.1;
If the KairosDB namespace is not available, (you would see an error like InvalidRequest: code=2200 [Invalid query] message="Keyspace 'kairosdb' does not exist" if it doesn't exist) then KairosDB is not connecting properly to Cassandra. Look at the logs in the terminal window for information, perhaps you don't have a port set correctly for contacting Cassandra, or perhaps KairosDB's network ports clash with another port being used on your Compute Engine instance. You might also have forgotten to change KairosDB from using H2 to Cassandra for its database.
Installing the Data Relay Server
OK, hopefully by now you have the MQTT broker, Cassandra, and KairosDB running. However, now the MQTT broker needs to talk to KairosDB to store your data in Cassandra. For this I have implemented the Data Relay Server. This server has an MQTT client that will receive data from the Raspberry Pi and then call KairosDB to ultimately store the data in Cassandra.
You can find the code for the Data Relay Server on github:
https://github.com/kmhughes/robotbrains-examples/tree/master/data/cloud/org.robotbrains.data.cloud.timeseries.server
You can find a zipped version of the server on Google Drive:
https://drive.google.com/file/d/0BxZiP9lENIZjbEZqM2d5dmRmdW8/view?usp=sharing
For now, download the Relay from Google Drive and unzip it in your home folder on the Compute Engine instance. It will eventually be placed in
/opt, but for now let's just have it running if you are logged into the Compute Engine instance.
Now you need to create a YAML file that will contain some configuration properties for the Data Relay Server. Here is a sample file I called
smartspacescloud.yaml.
mqtt.server.host: smartspaces.io
mqtt.server.port: 1883

mqtt.username: keith
mqtt.password: yourpassword

smartspaces.cloud.timeseries.topic.incoming: /smartspaces/cloud/timeseries/incoming
smartspaces.cloud.timeseries.node.name: /smartspaces/cloud/timseries/relay/server

database.kairosdb.connection.host: localhost
database.kairosdb.connection.port:8090
The first two properties set the host and port of the MQTT server that is being used to transfer your sensor data. Notice here it is pointing at my MQTT server. I am using the standard MQTT port. The values should match those for your server.
The next two properties give the user name and password you set up for your MQTT server account. Notice here the password is not given as its SHA256 hash, it is in plaintext.
The next two properties specifies the MQTT topic that the sensor data will be transferred on and how the MQTT client identifies itself.
The Data Relay Server will subscribe to the specified topic to receive the MQTT data from the Raspberry Pi, whereas the Raspberry Pi will be a publisher on this topic to send the data. Pick a name meaningful to you, here the name
/smartspaces/cloud/timeseries/incoming was chosen to be self documenting, this is the SmartSpaces topic for timeseries data coming into the cloud. If you wanted, you could call it something like
/foo/bar, but after you have a bunch of topics, it might then be hard to know what they are actually being used for if you use names like
/foo/bar.
The node name should also be meaningful, here
/smartspaces/cloud/timseries/relay/server. Notice that my Relay instance that runs on the Compute Engine instance ends with
server. The instance I run on my laptop for debugging ends in
laptop.
The final two properties specify which KairosDB instance the Server should talk to. The values supplied should be fine unless you changed the port that KairosDB listens on or placed it on another machine. If so, change the values accordingly.
You will make a file very similar to this one on your Raspberry Pi as well so you have the same information on both sides as both the Data Relay Server and the Raspberry Pi are MQTT clients, even though one is a subscriber to the data and one is a publisher. The copy on the Raspberry Pi can delete the two lines about KairosDB since you won't be running KairosDB on the Pi.
Say you unzipped the Data Relay Server and stayed in the folder that you unzipped the server into. You can start the server by typing
$ org.robotbrains.data.cloud.timeseries.server/bin/org.robotbrains.data.cloud.timeseries.server -c smartspacecloud.yaml
You should see a bunch of logging information going by telling you that everything is working. If not, double check your configuration parameters.
Now let's install the Relay in its final home. Move the server directory to
/opt. Once it is there then copy your configuration file into the config folder. Finally copy the systemd file that will start the Server on machine boot into the proper system folder and enable it and then start it running.
$ sudo mv org.robotbrains.data.cloud.timeseries.server /opt/robotbrainsclouddataserver
$ sudo mv smartspacecloud.yaml /opt/robotbrainsclouddataserver/config
$ sudo cp /opt/robotbrainsclouddataserver/bin/robotbrainsclouddataserver.service /etc/systemd/system
$ sudo systemctl enable robotbrainsclouddataserver.service
$ sudo systemctl start robotbrainsclouddataserver.service
If you have everything set up correctly, you should output appearing in
/var/log/robotbrainsclouddataserver/robotbrainsclouddataserver.log telling you that the Relay Server has started.
The Server has a bunch of pieces and explaining them all in detail would take a lot of room, but let's look at the highlights.
Start with
ServerMain and see how it pulls the server pieces together.
To understand the Raspberry Pi to Database Relay communication, look at the
PahoMqttRemoteDataRelay class. Its
startup() and
shutdown() methods show how to connect to and disconnect from the MQTT broker. JSON messages are used to encode the data between the Pi and the Relay, you can see the details starting from the
handleMessageArrived() method.
To see how data is transferred into KairosDB, look at the
KairosDbDatabaseRelay class. The
startup() and
shutdown() methods show how to set up and shut down communication with KairosDB. The
processSensorData() method takes data being transferred from the MQTT client and sets up the data structures needed to transfer it to KairosDB.
The Server Is Done!
Wow, that was a lot of work! But now you have your server configured, though it isn't doing anything yet but sitting there patiently waiting for your data.
While I wrote the software I did things very differently so I could test things as I went along. Here were my steps, more or less, in case you're curious about my approach,.
First I installed Moquette on the Compute Engine instance. I then wrote an MQTT publisher and an MQTT subscriber in Java and ran both on my laptop, making sure I could get roundtrip data. You can see my test clients here:
https://github.com/kmhughes/robotbrains-examples/tree/master/comm/mqtt
I then wrote the beginnings of the MQTT publisher in Python and made sure I could have the Python publisher write any sort of data whatsoever to the Java subscriber. In fact, I had it write
Hello, World, which is the time-honored first message that any program should send. The publisher was then copied to a Raspberry Pi to confirm I could get data from a Pi to the Java subscriber on my laptop.
Next was building the circuit for the Raspberry Pi and writing a small Python program to read the data from the sensors.
The sensor reading Python program was then combined with the MQTT publisher Python program and cleaned up. The data format was decided. I then checked that the newly combined sensor publisher Python program could send data to my Java subscriber.
I then took that Java subscriber and copied it into a new project and started creating the Data Relay Server.
Next I installed Cassandra and made sure I could connect to it with csqlsh. Once I knew that worked, I installed KairosDB and configured it so that it could talk to Cassandra. That took a couple of tries, but I was finally able to see the Cassandra namespace for KairosDB.
Next I took my nascent Relay Server and made it place random data into KairosDB. Once I saw the fake data successfully going in, I tried reading the fake data out.
Finally I connected the Kairos component of the Data Relay Server to the MQTT client in the Server and tested whether data went in and whether I could query it.
It was a lot of steps, but it meant at each step I understood that piece and knew it worked before I added in another step. If I had tried everything all at once it would have been VERY difficult to debug. It also meant I could really learn how to use each component in isolation. Trying to write everything all at once when not understanding any of the pieces would have been very hard.
Setting Up Your Raspberry Pi
I am using a Raspberry Pi 2 for this project. If you are not using a Pi 2, these directions may or may not work, I have not tested them on a Pi 1.
To keep things simple, let's use Python on the Raspberry Pi to access the sensors and send data to the cloud.
I tried using the Ubuntu installation for the Pi but had problems getting the Python library for accessing the Pi GPIO pins to work, so gave up and switched to Raspbian.
Python uses a package called pip to install Python packages. If you don't already have pip installed, you can install it with the following commands, depending on whether you use Python 2 or Python 3.
$ sudo apt-get install python-pip
$ sudo apt-get install python3-pip
You now need to install a variety of Python packages used by the sample code.
$ sudo apt-get install python-dev
$ sudo pip install rpi.gpio
$ sudo pip install pyyaml
$ sudo pip install paho-mqtt
If you are using Python 3, replace
pip in the above commands with
pip3.
Wiring
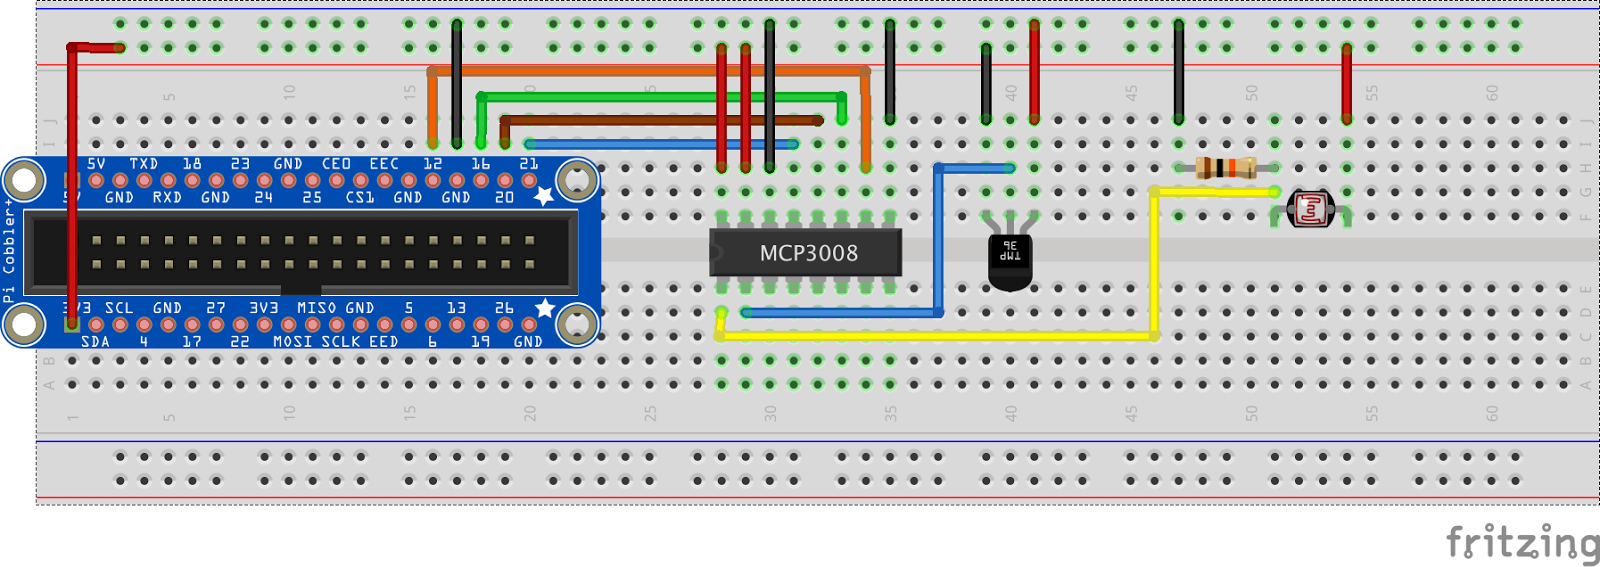
I chose to measure temperature and light levels in this post to keep things simple. I used a TMP36 for reading the temperature as it gives a very simple analog signal linear in the temperature being sensed. The light level was measured with a photoresistor, also giving an analog signal.
The Raspberry Pi does not come with analog to digital converters, so if you want to read analog signals, you will need an external A/D converter. I chose the MCP3008 A/D converter which gives an SPI interface for reading the analog data. I will not be describing the SPI protocol in this post, perhaps a later one, but there are good articles online if you want to Google them.
The complete circuit is given below. The resistor is a 10k, the photoresistor was just something I had in the house, I think its highest resistance was around 10k. And that big blue thing on the left side is a Raspberry Pi 2 Cobbler. The Cobblers make it really easy to breadboard with a Raspberry Pi, I recently bought a lot of them.
First the Fritzing diagram.
The following pictures show a bit of a rat's nest of wiring, the Fritzing will make things much more clear.
And with the Pi...
I am leaving this on a large breadboard in case I want to add more sensors to it over time.
The Python Program
The Python program can be found on github at
https://github.com/kmhughes/robotbrains-examples/tree/master/data/cloud/org.robotbrains.data.cloud.timeseries.client.
Copy the files
robotbrainsclouddataclient.py and
robotbrainsclouddataclient to your
/home/pi directory.
Now we need to have the client know about the MQTT broker in the cloud and what topics to publish on. Create a file called
smartspacescloud.yaml and place the following contents in it
mqtt.server.host: smartspaces.io
mqtt.server.port: 1883

mqtt.username: keith
mqtt.password: yourpassword

smartspaces.cloud.timeseries.topic.incoming: /smartspaces/cloud/timeseries/incoming
The properties here should match the properties in the Data Relay Server's
smartspacescloud.yaml. If you don't get them correct, the Data Relay Server will not get the data from your Pi. The host and port values should match the host and port for your MQTT server on your cloud instance.
Now let's try your client and see if you get data in the cloud. But first, let's see if we get any data at all. The Python program is initially configured to not contact the cloud and to write out sensor data every 5 seconds on the console.
Run the following commands on your Pi.
sudo ./robotbrainsclouddataclient.py smartspacescloud.yaml
The
sudo is necessary as you can only access the GPIO pins on the Pi as the
root user.
If you have wired everything properly, you should see sensor measurements being printed every 5 seconds on the Pi. If you don't see anything, check that your circuit is wired properly. If you do see data being printed, type ^C to end the program.
If your circuit worked, let's get data to the cloud.
On the cloud instance type the following command. This will let you see log output as it is written into the logs.
$ tail -f /var/log/robotbrainsclouddataserver/robotbrainsclouddataserver.log
Now open the Python script in your favorite editor and look for the line where the variable CONNECT is set equal to 0. Change the 0 to 1 and run the program again.
If you have connected everything properly, you should see sensor measurements coming into your cloud server every 5 seconds. If you don't see anything, make sure you have the same MQTT server connection information in the
smartspacescloud.yaml files on both machines and that the MQTT topic is the same on both sides.
Measurements every 5 seconds might be a bit much, I have my instance reading the sensors every 10 minutes. Once again, open up the Python script in your favorite editor. Change the value of
DEBUG from
1 to
0 to stop debugging output and change
SAMPLING_PERIOD to how many seconds you want between sensor measurements. As I said, I record measurements every 10 minutes so set the sampling period to
600.
We would like the Data Client to run whenever the Pi boots. To do so, copy
robotbrainsclouddataclient from
/home/pi to to
/etc/init.d. Then type the following command so that the Pi knows to run this script every time it boots.
$ update-rc.d robotbrainsclouddataclient defaults
The Python script has 5 major sections.
The first contains various parameters like
DEBUG,
CONNECT, and
SAMPLING_PERIOD that are used and which pins the sensors are attached to on the A/D converter chip.
The second section contains code from the folks at Adafruit for communicating with the A/D chip. It uses a technique called bit-banging, where the SPI signals are generated by turning digital pins on and off and reading digital pins, rather than using specialized pins and processor instructions that handle things like the SPI clock for you.
The next section creates a handler for the MQTT client for handling data connections and also sets up a handler to detect when a kill signal is sent to the script. The handler will shut down the MQTT client and perform any other needed cleanups.
The 4th section reads the configuration file and sets up the MQTT client.
The final section creates a loop that will read the sensor signals, format them into a JSON message, and then send them over the MQTT channel to the Data Relay for storage into the time series database.
Done For Now!
If you made it through everything, you are now reading sensor signals on your Raspberry Pi and storing them in a time series database in the cloud. As I said before, this is a lot of steps, so if it isn't working, find people you know who understand the pieces that aren't working and see if they can help.
Now that we have data going into the database, we need to get it out of the database so we can process it. I will soon be writing the code that allows queries for reading the data, uploading it to github and then write another post on how reading the data works.
Until next time...